
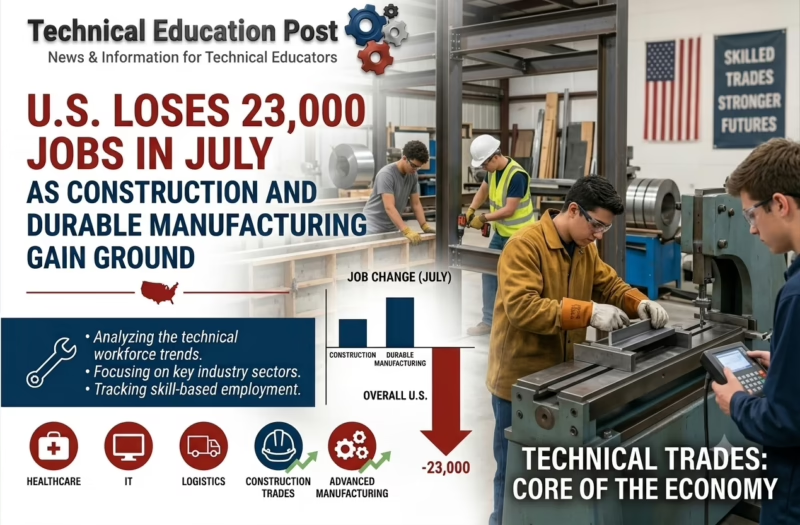
The U.S. labor market weakened in July, but the headline number masks a potentially important shift for career and technical education.
Nonfarm payroll employment declined by 23,000 in July 2026, according to data released Friday, August 7, by the U.S. Bureau of Labor Statistics. The unemployment rate was 4.1%. More significantly, previously reported employment gains for May and June were revised downward by a combined 103,000 jobs.
Yet the labor market underneath those numbers was far from uniform.
Private-sector employers added 30,000 jobs in July. Goods-producing industries added 25,000, including 22,000 in construction and 5,000 in manufacturing. Within manufacturing, durable-goods employment increased by 18,000 while nondurable manufacturing declined by 13,000.
For CTE directors, community colleges, workforce boards and employers, that divergence may be more important than the national headline.
The July report does not show a booming skilled-trades economy. Instead, it shows an increasingly selective labor market in which demand is concentrating in particular industries, technologies and occupational clusters.
That means technical education programs may need something more sophisticated than a general assumption that “the skilled trades are in demand.”
They need current labor-market intelligence.
Key Takeaways
- U.S. payroll employment declined by 23,000 in July 2026.
- May and June job estimates were revised downward by a combined 103,000.
- Private employers nevertheless added 30,000 jobs.
- Construction gained 22,000 jobs, with most of the increase occurring among specialty trade contractors.
- Durable-goods manufacturing gained 18,000 jobs while nondurable manufacturing lost 13,000.
- Transportation equipment, motor vehicles, machinery, fabricated metals, electronics and semiconductor manufacturing all posted July employment gains.
What Happened in the July Jobs Report
The national employment picture softened considerably.
Total nonfarm payrolls declined by 23,000 after an average monthly increase of only 34,000 during the previous 12 months. Meanwhile, the labor-force participation rate stood at 61.4%, down 0.7 percentage point since January.
The revisions were particularly noteworthy.
BLS reduced its May estimate from a gain of 129,000 jobs to 63,000 and lowered June from 57,000 to 20,000. Together, those revisions removed 103,000 previously reported jobs from the labor-market picture.
But private-sector employment still increased by 30,000 in July.
The decline in total employment was heavily influenced by government employment, which fell by 53,000, including a seasonally adjusted decline of approximately 50,000 in local government education.
That distinction matters when assessing employer demand.
Construction Was One of July’s Strongest Technical Sectors
Construction employment increased by 22,000 in July.
Most of that gain occurred among specialty trade contractors, which added approximately 18,000 jobs. Nonresidential specialty trade contractors accounted for about 15,400 of those positions.
That category includes contractors associated with many of the occupations served directly by CTE and apprenticeship programs, including electrical, mechanical and building-system trades.
The broader occupational outlook also remains favorable for several of these professions.
BLS projects electrician employment to increase 9% between 2024 and 2034, with approximately 81,000 openings annually during the decade.
For schools already following growth in data centers, advanced manufacturing plants and other large nonresidential construction projects, the July numbers reinforce an important point discussed previously by TechEd Magazine: infrastructure expansion increasingly translates into demand for electricians, HVAC professionals, controls technicians and other specialized workers.
Related TechEd coverage: Data Center Construction Growth
Manufacturing Is Splitting Into Two Different Labor Markets
Manufacturing deserves an even closer look.
Total manufacturing employment increased by only 5,000 in July, which BLS characterizes as little changed. But that top-line number combines two very different movements.
Durable-goods manufacturing added 18,000 positions.
Nondurable manufacturing lost 13,000.
Inside durable manufacturing, several industries closely connected to technical education posted gains:
| Manufacturing sector | July employment change |
|---|---|
| Transportation equipment | +11,900 |
| Motor vehicles and parts | +7,900 |
| Computer and electronic products | +2,900 |
| Machinery manufacturing | +2,600 |
| Fabricated metal products | +2,500 |
| Semiconductor and electronic components | +1,700 |
Source: U.S. Bureau of Labor Statistics, July 2026 Employment Situation.
For technical educators, this is a much more actionable picture than simply saying manufacturing added 5,000 jobs.
Programs supporting industrial maintenance, mechatronics, automation, CNC machining, electronics, robotics, automotive manufacturing and related fields are connected more directly to the portions of manufacturing currently showing relative strength.
That fits a larger trend TechEd Magazine has already been following in its coverage of America’s Advanced Manufacturing Workforce and AI Training for Manufacturing Workers.
But This Is Not Evidence of a Universal Skills Shortage
There is an important warning in the data.
Just three days before the July employment report, BLS reported that U.S. job openings remained at 7.4 million in June. But job openings in nondurable-goods manufacturing declined by 55,000.
That reinforces the same pattern appearing in the July payroll numbers.
Demand is becoming more selective.
Some industries, regions and technical occupations may have acute workforce shortages while neighboring industries experience slower hiring or contraction.
This distinction should matter enormously to CTE planning.
A program cannot justify expansion simply because “manufacturing needs workers” or “the trades are growing.”
Leaders increasingly need to know:
Which manufacturing industries are hiring locally?
Which occupations are employers struggling to fill?
Which credentials appear repeatedly in job postings?
Which employers are expanding facilities?
Which skills are changing because of automation and AI?
And are those signals strong enough to justify additional enrollment, instructors or laboratory equipment?
That question complements TechEd Magazine’s earlier examination of whether the country sometimes faces a skills shortage or an exposure shortage.
The Occupational Data Point Toward Higher-Skill Technical Roles
Another reason educators should look below the industry totals is automation.
Not every manufacturing occupation is projected to grow.
BLS projects employment among industrial machinery mechanics, machinery maintenance workers and millwrights to increase 13% between 2024 and 2034, with approximately 54,200 openings per year.
Machinist and tool-and-die employment, by comparison, is projected to decline 2% overall, although BLS still expects approximately 34,200 annual openings because workers will retire, transfer occupations or otherwise leave the field.
That distinction is a curriculum signal.
The future of manufacturing education is not necessarily about producing more graduates for every production occupation. It may increasingly involve preparing students for occupations combining mechanical expertise with controls, automation, electronics, diagnostics, robotics and computerized equipment.
Pay Remains Significant in Construction and Manufacturing
July BLS data also show the earnings associated with these industries.
Average hourly earnings for all private-sector employees were $37.62.
Construction averaged $41.46 per hour, while manufacturing averaged $36.87. Durable-goods manufacturing averaged $39.12. These are industrywide averages rather than starting wages for individual occupations, but they provide additional context for the economic scale of these sectors.
For CTE leaders trying to demonstrate the labor-market value of technical pathways, employment demand and earnings should increasingly be evaluated together.
A Funding Opportunity Makes the Timing Especially Relevant
The labor-market data arrive while states have an active federal opportunity to expand industry-driven workforce training.
The U.S. Department of Labor is accepting applications for approximately $40 million in a second round of Industry-Driven Skills Training Fund grants, including at least $5 million designated for shipbuilding-related training.
The application deadline is August 17, 2026.
The grants are directed to states and designed to support employer-driven training responsive to changing skills demands and local workforce conditions.
For community colleges, technical colleges, workforce boards and employers, that creates an immediate reason to communicate with state workforce agencies about industries demonstrating genuine hiring demand.
What CTE Leaders Should Do Now
The July report suggests that program planning should become more granular.
Rather than reviewing labor-market information once during a multi-year curriculum revision, institutions should consider creating a recurring process that combines BLS data, state employment projections, job postings, employer advisory committees and actual placement results.
A quarterly labor-market review could identify changes before they become obvious in enrollment or graduate-placement statistics.
Programs serving manufacturing should also distinguish among manufacturing subsectors.
“Manufacturing” is too broad to function as a useful workforce strategy when transportation equipment is gaining employment while food manufacturing, chemicals and other nondurable categories are moving in another direction.
The same principle applies to construction.
July’s strongest construction movement came from specialty contractors—particularly nonresidential specialty trades—not evenly across the entire industry.
Questions to Ask Your Program
- Have local employers validated our employment assumptions within the past six months?
- Do we track individual manufacturing subsectors rather than manufacturing as one category?
- Are enrollment targets based on projected occupations or historical demand?
- Do our laboratories reflect the automation, controls and diagnostic skills employers now require?
- Could upcoming state or federal workforce funding accelerate a program employers are already requesting?
What Happens Next
Educators should treat the July figures as an important signal, but not the final word.
Monthly payroll estimates are preliminary and routinely revised.
That is especially important now because BLS will publish its preliminary annual benchmark revision on August 28, 2026. The benchmark process uses more comprehensive state unemployment-insurance employment records to evaluate the monthly establishment survey estimates.
The July Job Openings and Labor Turnover Survey is scheduled for September 1, followed by the August Employment Situation report on September 4.
Those releases should help determine whether July represented a temporary fluctuation or the beginning of a clearer shift toward more concentrated employer demand.
Frequently Asked Questions
Did the United States lose jobs in July 2026?
Yes. Preliminary BLS estimates show total nonfarm payroll employment declined by 23,000 in July. The unemployment rate was 4.1%.
Did construction employment increase?
The July point estimate shows construction employment increasing by 22,000, including approximately 18,000 additional specialty-trade contractor jobs. BLS nevertheless categorized overall construction employment as showing little change for the month, so the figure should not be interpreted as proof of a sustained boom.
Did manufacturing employment increase?
Manufacturing increased by 5,000 overall. Durable manufacturing increased by 18,000 while nondurable manufacturing declined by 13,000.
Which manufacturing sectors gained the most jobs?
Transportation equipment showed the largest detailed gain at approximately 11,900 jobs, including about 7,900 in motor vehicles and parts. Machinery, fabricated metals, computer and electronic products and semiconductor manufacturing also posted gains.
What does the report mean for career and technical education?
The strongest implication is that workforce demand is becoming increasingly specific to industries and occupations. CTE programs should therefore evaluate local employer demand at a more detailed level rather than using broad claims about national skilled-worker shortages to make program decisions.
TechEd Magazine Perspective
The most important lesson from the July jobs report may not be that America lost 23,000 jobs.
It is that a slowing national labor market can coexist with meaningful demand for specific technical skills.
That makes precision increasingly important.
As Workforce Pell, apprenticeship expansion, employer-funded training and federal workforce investments push education closer to labor-market outcomes, technical programs will be under greater pressure to demonstrate that what they teach corresponds to jobs employers are actually creating.
The phrase “skills gap” is no longer specific enough.
The better questions are: Which skills? In which industries? In which regions? For which occupations? And is the demand growing now?
July’s employment data provide another reminder that the institutions best positioned for the next phase of workforce education will be those capable of answering those questions continuously—not every five years.
Sources and Further Reading
U.S. Bureau of Labor Statistics — Employment Situation, July 2026
U.S. Bureau of Labor Statistics — Job Openings and Labor Turnover, June 2026
U.S. Department of Labor — Industry-Driven Skills Training Fund
BLS Occupational Outlook — Electricians
BLS Occupational Outlook — Industrial Machinery Mechanics and Millwrights